社会网络数据分析可以帮助您理解个人或业务来往方面的内容、联系和机会。本文给出的工具和代码通过 Twitter API 绘制、地理定位和可视化社会网络数据,从社会网络中提取关键数据。
本文是一篇概念证明,演示如何构建用于可视化相互联系和影响的应用程序。在对话中记下常见的主题关键词,并创建表示您的朋友的地理位置的地图。本文给出的代码借助 Perl、Graphviz、Cooperative Association for Internet Data Analysis (CAIDA) plot-latlong 和 Google Chart API 创建对分析社会网络数据非常有用的视图。
硬件和软件需求
2000 年以后制造的 PC 应该都能够编译和运行本文提供的代码。对于本文,CAIDA 的 plot-latlong 工具需要 UNIX® 式的操作系统来创建地理地图。其他视图由 curl 和 Graphviz 完成,这两个工具在许多平台上都可以使用。
需要使用 Perl 和 XML::Simple、Geo::Coder::Yahoo 和 GD Perl 模块处理社会网络数据。同时也推荐使用良好的图像查看器,比如 feh。为了将用户图像转换为标准的 PNG 格式,需要使用 ImageMagick 的 “convert” 组件。参见 参考资料 了解从哪里可以找到这些程序。
为了在基于 Debian 的 Linux® 发布版(比如 Ubuntu)上安装这些应用程序,需要在终端窗口中输入以下命令:sudo apt-get install perl feh imagemagick curl graphviz。plot-latlong 需要手动下载。解压缩 plot-latlong 文件之后,将 .mapimages 目录和 .mapinfo 文件复制到 ${HOME} 目录。
尽管本文演示的代码是针对 Linux 平台的,但是只需略作修改,数据收集和处理代码就能用于任何支持 Perl 的平台,比如 Microsoft® Windows®。
使用 Twitter API 提取社会网络数据
Twitter 的 REST 式接口和清晰的 API 文档为访问社会网络属性提供很好的方法。参见 参考资料 更多地了解 Twitter API。清单 1 显示了初始 buildViz.pl 程序的设置。
清单 1. buildViz.pl,第 1 部分
#!/usr/bin/perl -w
# buildViz.pl create social networking visualizations
use strict;
use XML::Simple;

die "specify searchUser, username, password, mode " unless @ARGV == 4;
my( $search, $user, $pass, $mode ) = @ARGV;

my $cmd = "mkdir xml/; mkdir img/";
system( $cmd ) unless( -d "xml" && -d "img" );

# get user's profile data
$cmd  = qq{ curl -u $user:$pass "http://twitter.com/users/show/$user.xml" };
$cmd .= qq{ > xml/$user.xml };

system( $cmd ) unless( -e "xml/$user.xml" );

  # get profile image
  my $xmlImg = XMLin( "xml/$user.xml" );
  my $imgUrl = $xmlImg->{profile_image_url};
  $cmd  = qq{ curl "$imgUrl" > img/$user.png ; };
  $cmd .= qq{ convert -format png img/$user.png img/$user.png };
  system( $cmd ) unless( -e "img/$user.png" );

# get users' friends (people that user is following)
$cmd  = qq{ curl -u $user:$pass "http://twitter.com/statuses/friends.xml" };
$cmd .= qq{ > xml/$user.friends.xml };
system( $cmd ) unless( -e "xml/$user.friends.xml" );
|
在指定需要的模块和 Twitter API 凭证之后,就可以创建目录并获取面向指定用户的 XML。注意,您可以为任何未保护更新的 Twitter 用户创建视图。XML 文件需要具有良好的格式,这要求对 XML 文件只执行一次检索,因此如果 XML 文件不在本地文件系统上,将对所有 XML 文件进行检索。如果需要最新的数据,则需要手动删除这些文件。
接下来,下载指定用户的图像及其朋友列表。为了与 Twitter API 文档保持一致,本文使用的术语 “朋友(friends)” 和 “跟随者(people you are following)” 表示相同的意思。清单 2 继续为指定的用户朋友检索朋友。
清单 2. buildViz.pl,第 2 部分
my $xmlFriend = XMLin( "xml/$user.friends.xml" );

for my $name ( keys %{ $xmlFriend->{user} } )
{
  my $userFr = $xmlFriend->{user}->{$name}->{screen_name};

  # get friends' friends
  $cmd  = qq{ curl -u $user:$pass "http://twitter.com/statuses/friends/};
  $cmd .= qq{$userFr.xml?page=1" > xml/$userFr.friends.xml};
  system( $cmd ) unless( -e "xml/$userFr.friends.xml" );

  # get friends most recent 200 tweets
  $cmd  = qq{ curl -u $user:$pass "http://twitter.com/statuses/user_timeline/};
  $cmd .= qq{$userFr.xml?count=200" > xml/$userFr.user_timeline.xml};
  system( $cmd ) unless( -e "xml/$userFr.user_timeline.xml" );

  # get friends image (requires imagemagick convert)
  my $imgUrl = $xmlFriend->{user}->{$name}->{profile_image_url};
  $cmd  = qq{ curl "$imgUrl" > img/$userFr.png ; };
  $cmd .= qq{ convert -format png img/$userFr.png img/$userFr.png };
  system( $cmd ) unless( -e "img/$userFr.png" );

}#for each friend
|
再次查看社会网络联系人时,您将看到您的朋友有许多共享朋友。unless ( -e 部分仅检索特定的 XML 文件,帮助减少 Twitter 服务器的负载。
除了 “朋友的朋友(friends of friends)” 列表之外,还获取每个朋友的消息记录和头像。将清单 1 和清单 2 保存为 buildViz.pl 文件,并输入命令 perl buildViz.pl searchUser yourUserName yourPassword retrieve。在这里,searchUser 是您需要获取其社会网络数据的 Twitter 用户的用户名。yourUserName 和 yourPassword 是您的身份验证凭证,而 retrieve 仅是用于指定 XML 下载的占位符。
buildViz.pl 程序将创建 img 和 xml 子目录,并使用类似以下内容的文件填充它们。
清单 3. 示例 img/ xml/ 目录
87953 2008-11-26 08:21 xml/agberg.friends.xml 187263 2008-11-26 08:21 xml/agberg.user_timeline.xml 85451 2008-11-26 08:23 xml/alphaworks.friends.xml 50967 2008-11-26 08:23 xml/alphaworks.user_timeline.xml 85854 2008-11-26 08:21 xml/andysc.friends.xml 163570 2008-11-26 08:21 xml/andysc.user_timeline.xml 83236 2008-11-26 08:23 xml/BillHiggins.friends.xml 177740 2008-11-26 08:23 xml/BillHiggins.user_timeline.xml ... 5626 2008-11-26 08:21 img/agberg.png 5753 2008-11-26 08:23 img/alphaworks.png 2080 2008-11-26 08:21 img/andysc.png 4527 2008-11-26 08:23 img/BillHiggins.png |
使用 Graphviz 开发相互联系数据和视图
要衡量特定用户对其朋友的影响力,可以通过估算他拥有的朋友的数量来实现。从理论上讲,朋友更少的用户有更多的时间来更新社会网络和回答相关问题。在 buildViz.pl 的第 53 行处添加清单 4 的内容。
清单 4. visualizeInfluence 子例程
visualizeInfluence() if( $mode eq "influence" );

### begin subroutines

sub visualizeInfluence
{
  my %frHash = ();
  my $xmlFriend = XMLin( "xml/$user.friends.xml" );
  for my $name ( keys %{ $xmlFriend->{user} } )
  {
    my $userFr = $xmlFriend->{user}->{$name}->{screen_name};
    my $xmlSec = XMLin( "xml/$userFr.friends.xml" );

    $frHash{ $userFr } = 0;
    for my $linkUser( keys %{ $xmlSec->{user} } ){  $frHash{$userFr}++  }

  }#for each friend

  my $infList = "1 $user\n";
  for my $name ( sort {$frHash{$a} <=> $frHash{$b}} keys %frHash )
  {
    $infList .= "$frHash{$name} $name\n";
    last if( ($infList =~ s/\n/\n/g) == 15 );  # exit after fifteen lines

  }# for each key sorted

  chop($infList); # remove last newline
  $cmd  = qq{ echo "$infList" | perl twitdot.pl $user img > influence.fdp ; };
  $cmd .= qq{ fdp influence.fdp -Tpng -o graphviz_influence.png };

  system($cmd);

}#visualizeInfluence
|
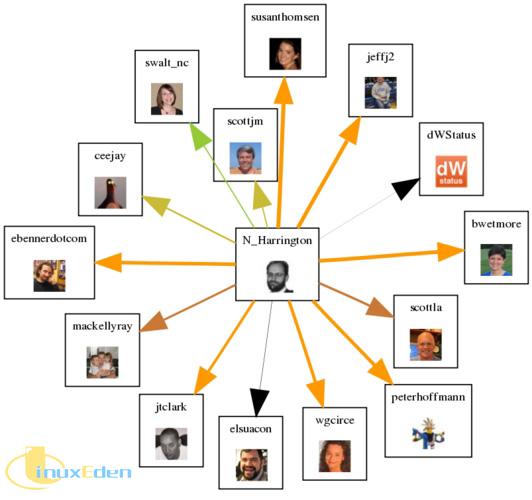
计算每个朋友的朋友列表,将 15 位最有影响力的朋友添加到 $infList 变量。这些计数和朋友名称组合一起作为输入传递给 twitdot.pl 程序。基于来自 “探究 Web 页面之间的可视化关系” 这篇文章的代码,twitdot.pl 程序为 Graphviz 生成 fdp 图形生成语法。参考这篇文章和代码 下载 小节,获得更多关于修改这个特殊视图的信息。
接下来,通过 fdp 图像语法文件调用 fdp 来生成视图。通过命令 perl buildViz.pl searchUser yourUserName yourPassword influence 运行该程序,然后在图像查看器中查看输出文件(graphviz_influence.png)。图 1 显示了示例 graphviz_influence.png。
图 1. 示例 graphviz_influence.png

根据拥有的朋友的数量,箭头的粗细和颜色表示每个朋友的 “影响力”。
使用 Google chart API 开发关键词数据和视图
评测了影响力之后,则应该考虑如何处理内容了!将清单 5 中的代码添加到 buildViz.pl 的第 87 行,创建一个图表来显示消息记录中最常用的词语。
清单 5. visualizeKeywords 子例程
sub visualizeKeywords
{
  my %wordHash = ();
  my $xmlFriend = XMLin( "xml/$user.friends.xml" );
  for my $name ( keys %{ $xmlFriend->{user} } )
  {
    my $userFr = $xmlFriend->{user}->{$name}->{screen_name};
    my $xmlSec = XMLin( "xml/$userFr.user_timeline.xml" );

    for my $linkUser(  keys %{ $xmlSec->{status} }  )
    {
      my $msgText = $xmlSec->{status}->{$linkUser}->{text};
      for my $key( split " ", lc($msgText) ){  $wordHash{$key}++  }

    }#for each text update

  }#for each friend

  my $tStr = "";
  my $chlStr = "";
  for my $word ( sort {$wordHash{$b} <=> $wordHash{$a}} keys %wordHash )
  {
    next unless( length($word) > 10 );    # only print 'long' entries
    $tStr .= "$wordHash{$word},";         # append url data
    $chlStr .= "$word|";                  # append url labels
    last if( ($tStr =~ s/,/,/g) == 10 );  # exit loop after first ten words

  }#for the top words

  chop($tStr); chop($chlStr);  # remove trailing delimiters

  $cmd  = qq{ curl "http://chart.apis.google.com/chart?cht=p&chd=t:$tStr};
  $cmd .= qq{&chs=1000x300&chl=$chlStr" > chart_keywords.png };
  system($cmd);

}#visualizeKeywords
|
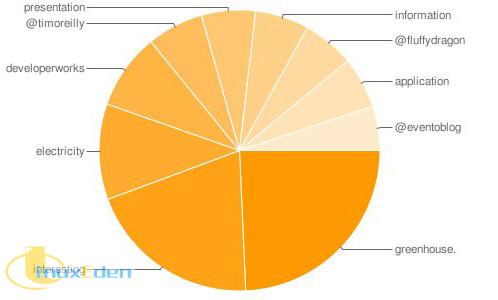
每个朋友的消息记录中的每个词都记录在 %wordHash 变量中。要计算最常见的用语,单词的长度至少为 10 才能生成图像。前 10 个满足这些条件的单词及其频率统计将包装到一个 URL 中,然后通过 Google Chart API 生成图像。查看 参考资料 小节了解更多关于 URL 格式和可用 Google Chart 选项的信息。
将以下给出的子例程添加到 buildViz.pl 的第 54 行。
清单 6. visualizeKeywords 逻辑调用
visualizeKeywords() if( $mode eq "keywords" ); |
通过命令 perl buildViz.pl searchUser yourUserName yourPassword keywords 运行关键词视图。使用图像查看器查看输出文件 chart_keywords.png。图 2 显示了该文件。
图 2. 示例 chart_keywords.png

使用 plot-latlong 开发地理定位数据和视图
在记录了受到影响的人和谈话内容之后,我们可以进一步可视化这些人的地理位置。将清单 7 中的代码添加到 buildViz.pl 的第 125 行。
清单 7. visualizeLocations 子例程
sub visualizeLocations
{
  use Geo::Coder::Yahoo;
  my $geocoder = Geo::Coder::Yahoo->new(appid => 'my_app' );

  open( LOCOUT, ">locationNames" ) or die "no locationNames out\n";
  open( COORDS, ">cityCoords" )    or die "no cityCoords out \n";

  # record all friends geographical locations
  my $xmlFriend = XMLin( "xml/$user.friends.xml" );
  for my $name ( keys %{ $xmlFriend->{user} } )
  {
    my $userLoc = $xmlFriend->{user}->{$name}->{location};
    my $imgName = $xmlFriend->{user}->{$name}->{screen_name};
    my $location = $geocoder->geocode( location => "$userLoc" );

    for my $coords( @{$location} )
    {
      my %hashRef = %{ $coords };
      print "$hashRef{latitude} $hashRef{longitude} # $userLoc\n";
      print COORDS "$hashRef{latitude} $hashRef{longitude} # $userLoc\n";
      print LOCOUT "$userLoc ##$imgName.png\n";

    }#for coordinates returned

  }#for each friend

  close( COORDS ); close( LOCOUT );

  # draw the map
  $cmd  = qq{ cat cityCoords | perl plot-latlong -s 5 -c };
  $cmd .= qq{ > cityMap.png 2>cityPixels };
  system( $cmd );

  # Annotate the map with the first 7 friends information
  $cmd  = qq{ head -n7 locationNames > 7.locationNames ; };
  $cmd .= qq{ head -n7 cityPixels > 7.cityPixels ; };
  $cmd .= qq{ perl worldCompositeMap.pl 7.cityPixels 7.locationNames };
  $cmd .= qq{ cityMap.png worldCityMap_annotated.png };
  system($cmd);

}#visualizeLocations
|
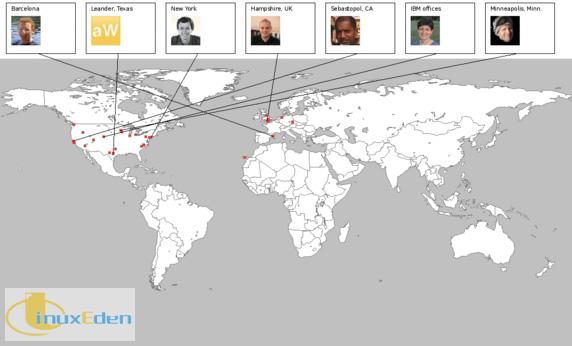
这里又可以使用 developerWorks 以前发布的代码。“使用 Perl、GD 和 plot-latlong 创建数据的地理标绘” 这篇文章详细描述了 worldCompositeMap.pl 程序。使用优秀的 Geo::Coder::Yahoo 模块可以轻松地在 cityCoords 文件中记录您的朋友所在城市的地理坐标,以及在 locationNames 文件中记录相关的名称和图像数据。
然后将第一批共 7 个朋友的位置和标识符传递给 worldCompositeMap.pl 并显示出来。参考以上链接提供的文章或 下载 小节获得更多关于 worldCompositeMap.pl 程序的信息。
将清单 8 中的子例程调用添加到 buildViz.pl 的第 55 行。
清单 8. visualizeLocations 逻辑调用
visualizeLocations() if( $mode eq "locations" ); |
运行命令 perl buildViz.pl searchUser yourUserName yourPassword locations 构建 worldCityMap_annotated.png 文件,然后在图像查看器中打开该文件。图 3 显示了这个文件。
图 3. 示例 worldCityMap_annotated.png

结束语
通过本文提供的代码和工具,您可以创建各种视图,帮助分析社会网络的特征。可以使用这些工具跟踪朋友圈中的关键词。您可以可视化特定联系人在全球各地的活动路径。为您的老板创建图表和分析数据,帮助他们了解社会网络的潜在价值。(责任编辑:A6)
 3G Eden
 RSS
RSS