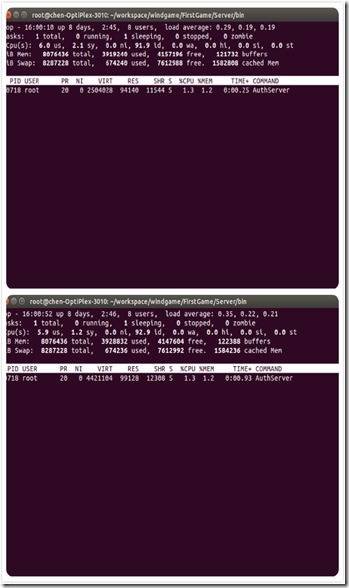
最近游戏已上线运营,进行服务器内存优化,发现一个非常奇妙的问题,我们的认证服务器(AuthServer)负责跟第三方渠道SDK打交道(登陆和充值),由于采用了curl阻塞的方式,所以这里开了128个线程,奇怪的是每次刚启动的时候占用的虚拟内存在2.3G,然后每次处理消息就增加64M,增加到4.4G就不再增加了,由于我们采用预分配的方式,在线程内部根本没有大块分内存,那么这些内存到底是从哪来的呢?让人百思不得其解。

1.探索
一开始首先排除掉内存泄露,不可能每次都泄露64M内存这么巧合,为了证明我的观点,首先,我使用了valgrind。
|
1: valgrind --leak-check=full --track-fds=yes --log-file=./AuthServer.vlog &
|
然后启动测试,跑至内存不再增加,果然valgrind显示没有任何内存泄露。反复试验了很多次,结果都是这样。
在多次使用valgrind无果以后,我开始怀疑程序内部是不是用到mmap之类的调用,于是使用strace对mmap,brk等系统函数的检测:
|
1: strace -f -e"brk,mmap,munmap" -p $(pidof AuthServer)
|
其结果如下:
|
[pid 19343] mmap(NULL, 134217728, PROT_NONE, MAP_PRIVATE|MAP_ANONYMOUS|MAP_NORESERVE, -1, 0) = 0x7f53c8ca9000
[pid 19343] munmap(0x7f53c8ca9000, 53833728) = 0
[pid 19343] munmap(0x7f53d0000000, 13275136) = 0
[pid 19343] mmap(NULL, 8392704, PROT_READ|PROT_WRITE, MAP_PRIVATE|MAP_ANONYMOUS|MAP_STACK, -1, 0) = 0x7f53d04a8000
Process 19495 attached
|
我检查了一下trace文件也没有发现大量内存mmap动作,即便是brk动作引起的内存增长也不大。于是感觉人生都没有方向了,然后怀疑是不是文件缓存把虚拟内存占掉了,注释掉了代码中所有读写日志的代码,虚拟内存依然增加,排除了这个可能。
2.灵光一现
后来,我开始减少thread的数量开始测试,在测试的时候偶然发现一个很奇怪的现象。那就是如果进程创建了一个线程并且在该线程内分配一个很小的内存1k,整个进程虚拟内存立马增加64M,然后再分配,内存就不增加了。测试代码如下:
|
#include <iostream>
#include <stdio.h>
#include <stdlib.h>
#include <unistd.h>
using namespace std;
volatile bool start = 0;
void* thread_run( void* )
{
while ( 1 )
{
if ( start )
{
cout << "Thread malloc" << endl;
char *buf = new char[1024];
start = 0;
}
sleep( 1 );
}
}
int main()
{
pthread_t th;
getchar();
getchar();
pthread_create( &th, 0, thread_run, 0 );
while ( (getchar() ) )
{
start = 1;
}
return(0);
}
|
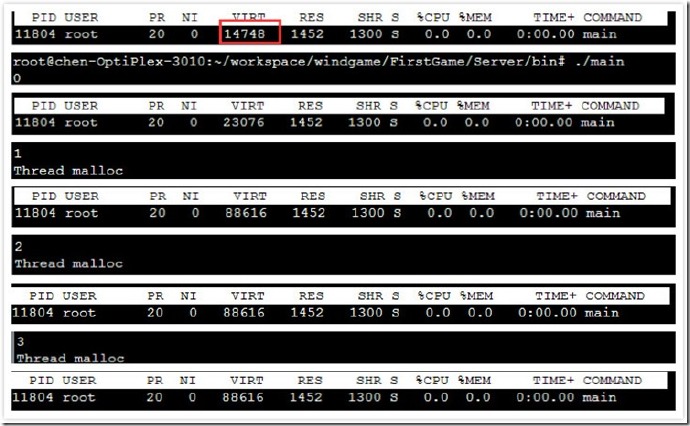
其运行结果如下图,刚开始时,进程占用虚拟内存14M,输入0,创建子线程,进程内存达到23M,这增加的10M是线程堆栈的大小(查看和设置线程堆栈大小可用ulimit –s),第一次输入1,程序分配1k内存,整个进程增加64M虚拟内存,之后再输入2,3,各再次分配1k,内存均不再变化。

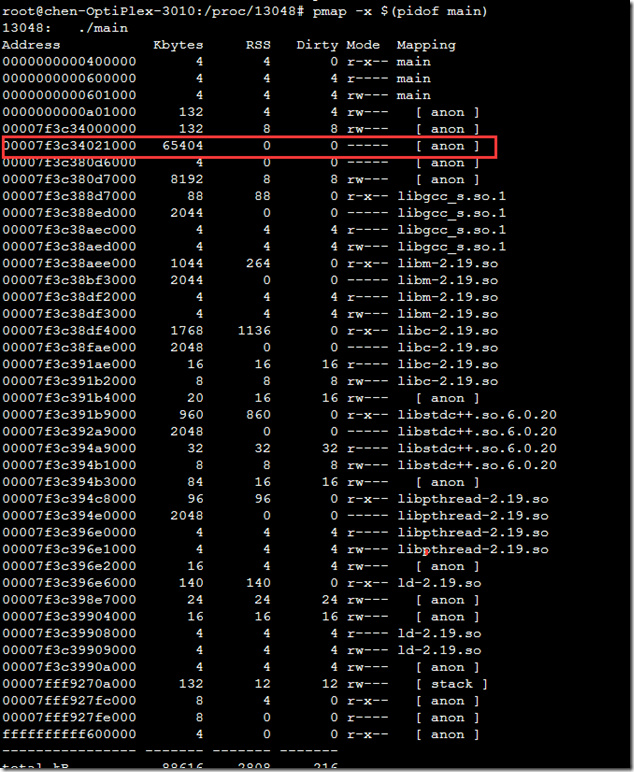
这个结果让我欣喜若狂,由于以前学习过谷歌的Tcmalloc,其中每个线程都有自己的缓冲区来解决多线程内存分配的竞争,估计新版的glibc同样学习了这个技巧,于是查看pmap $(pidof main) 查看内存情况,如下:

请注意65404这一行,种种迹象表明,这个再加上它上面那一行(在这里是132)就是增加的那个64M)。后来增加thread的数量,就会有新增thread数量相应的65404的内存块。
3.刨根问底
经过一番google和代码查看。终于知道了原来是glibc的malloc在这里捣鬼。glibc 版本大于2.11的都会有这个问题:在redhat 的官方文档上:https://access.redhat.com/documentation/en-US/Red_Hat_Enterprise_Linux/6/html/6.0_Release_Notes/compiler.html
| Red Hat Enterprise Linux 6 features version 2.11 of glibc, providing many features and enhancements, including… An enhanced dynamic memory allocation (malloc) behaviour enabling higher scalability across many sockets and cores.This is achieved by assigning threads their own memory pools and by avoiding locking in some situations. The amount of additional memory used for the memory pools (if any) can be controlled using the environment variables MALLOC_ARENA_TEST and MALLOC_ARENA_MAX. MALLOC_ARENA_TEST specifies that a test for the number of cores is performed once the number of memory pools reaches this value. MALLOC_ARENA_MAX sets the maximum number of memory pools used, regardless of the number of cores. |
The developer, Ulrich Drepper, has a much deeper explanation on his blog:http://udrepper.livejournal.com/20948.html
| Before, malloc tried to emulate a per-core memory pool. Every time when contention for all existing memory pools was detected a new pool is created. Threads stay with the last used pool if possible… This never worked 100% because a thread can be descheduled while executing a malloc call. When some other thread tries to use the memory pool used in the call it would detect contention. A second problem is that if multiple threads on multiple core/sockets happily use malloc without contention memory from the same pool is used by different cores/on different sockets. This can lead to false sharing and definitely additional cross traffic because of the meta information updates. There are more potential problems not worth going into here in detail.
The changes which are in glibc now create per-thread memory pools. This can eliminate false sharing in most cases. The meta data is usually accessed only in one thread (which hopefully doesn’t get migrated off its assigned core). To prevent the memory handling from blowing up the address space use too much the number of memory pools is capped. By default we create up to two memory pools per core on 32-bit machines and up to eight memory per core on 64-bit machines. The code delays testing for the number of cores (which is not cheap, we have to read /proc/stat) until there are already two or eight memory pools allocated, respectively. While these changes might increase the number of memory pools which are created (and thus increase the address space they use) the number can be controlled. Because using the old mechanism there could be a new pool being created whenever there are collisions the total number could in theory be higher. Unlikely but true, so the new mechanism is more predictable. … Memory use is not that much of a premium anymore and most of the memory pool doesn’t actually require memory until it is used, only address space… We have done internally some measurements of the effects of the new implementation and they can be quite dramatic. |
| New versions of glibc present in RHEL6 include a new arena allocator design. In several clusters we’ve seen this new allocator cause huge amounts of virtual memory to be used, since when multiple threads perform allocations, they each get their own memory arena. On a 64-bit system, these arenas are 64M mappings, and the maximum number of arenas is 8 times the number of cores. We’ve observed a DN process using 14GB of vmem for only 300M of resident set. This causes all kinds of nasty issues for obvious reasons.
Setting MALLOC_ARENA_MAX to a low number will restrict the number of memory arenas and bound the virtual memory, with no noticeable downside in performance – we’ve been recommending MALLOC_ARENA_MAX=4. We should set this in hadoop-env.sh to avoid this issue as RHEL6 becomes more and more common. |
总结一下,glibc为了分配内存的性能的问题,使用了很多叫做arena的memory pool,缺省配置在64bit下面是每一个arena为64M,一个进程可以最多有 cores * 8个arena。假设你的机器是4核的,那么最多可以有4 * 8 = 32个arena,也就是使用32 * 64 = 2048M内存。 当然你也可以通过设置环境变量来改变arena的数量.例如export MALLOC_ARENA_MAX=1
hadoop推荐把这个值设置为4。当然了,既然是多核的机器,而arena的引进是为了解决多线程内存分配竞争的问题,那么设置为cpu核的数量估计也是一个不错的选择。设置这个值以后最好能对你的程序做一下压力测试,用以看看改变arena的数量是否会对程序的性能有影响。
mallopt(M_ARENA_MAX, xxx)如果你打算在程序代码中来设置这个东西,那么可以调用mallopt(M_ARENA_MAX, xxx)来实现,由于我们AuthServer采用了预分配的方式,在各个线程内并没有分配内存,所以不需要这种优化,在初始化的时候采用mallopt(M_ARENA_MAX, 1)将其关掉,设置为0,表示系统按CPU进行自动设置。
4.意外发现
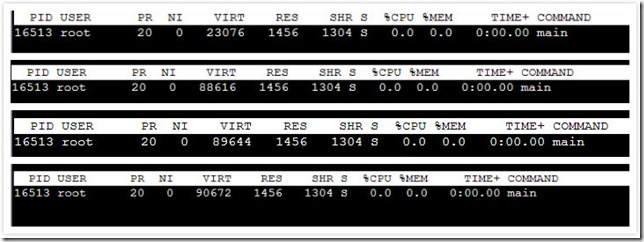
想到tcmalloc小对象才从线程自己的内存池分配,大内存仍然从中央分配区分配,不知道glibc是如何设计的,于是将上面程序中线程每次分配的内存从1k调整为1M,果然不出所料,再分配完64M后,仍然每次都会增加1M,由此可见,新版 glibc完全借鉴了tcmalloc的思想。

忙了几天的问题终于解决了,心情大好,通过今天的问题让我知道,作为一个服务器程序员,如果不懂编译器和操作系统内核,是完全不合格的,以后要加强这方面的学习。
转自 http://blog.jobbole.com/83878/
 3G Eden
 RSS
RSS